Project Management For Managers
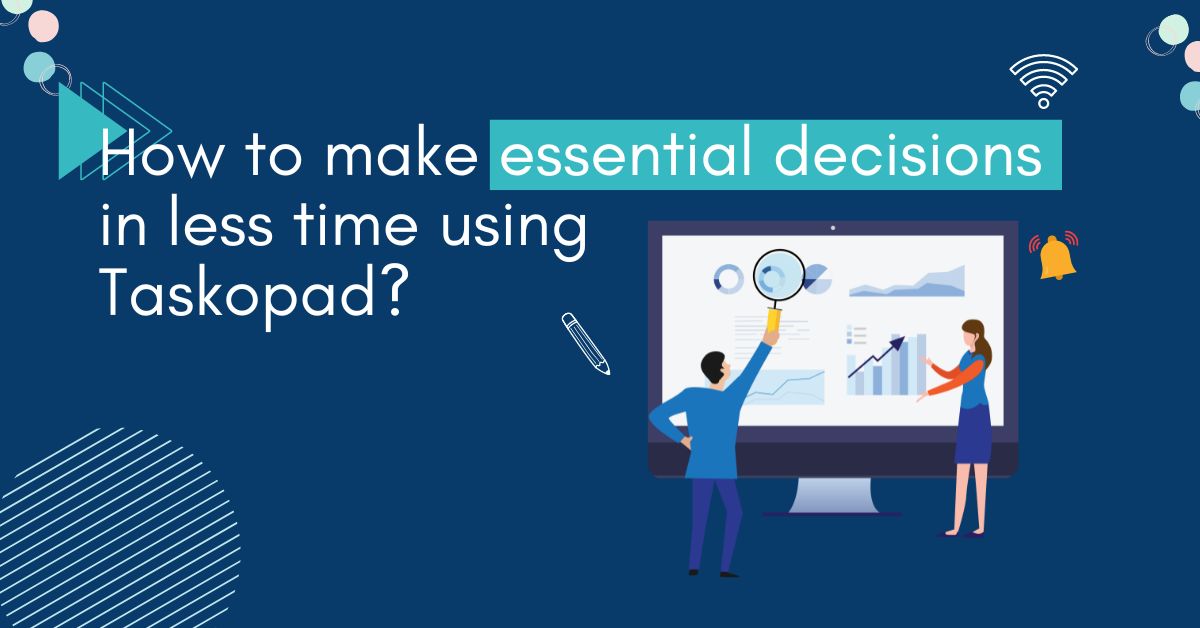
Make important essential decision in less time?
Jan 30th, 2023
Decisions are everywhere. You make them every day, whether it’s what to have for lunch, what movie to watch, or what career path to take essential decisions.
Making a essential decision can be difficult and tedious, especially when the options are many and they could be better.
Luckily, some reports can help you make more informed decisions to achieve your business goals and objectives faster. In this article, we will discuss the Taskopad reporting option that helps you make faster and better essential decisions in your business.
What is a target graph?
A target graph is a report that can help you make decisions faster. It is a visual representation of data and helps you to focus on specific areas of your business.
Several different types of reports can help you make faster and better business decisions. We will discuss each type of report provided by Taskopad below:
1. Financial reports
Financial reports are essential reports that help you to track your business’s finances. They can show you how well your business is doing and what areas need improvement.
2. Marketing reports
Marketing reports can help you understand your marketing efforts’ effectiveness and make changes if needed. They can also indicate which channels work best for promoting your product or service.
3. Sales report
Sales reports can help you identify which sales channels are performing well and which need improvement. They can also indicate how much your business makes from sales activity.
4. Operational reports
Operational reports can help you to understand your business’s performance in different areas. For example, they can show how much product was ordered, how much inventory was produced, and so on.
5. Customer report
Customer reports can help you identify which of your customers are most profitable and which require more attention from your team. They also indicate how satisfied or unhappy your customers are with your product or service.
How to make essential decisions in less time using Taskopad?
Here are a few steps you can take to make crucial decisions easy with the help of Taskopad’s multiple reporting facility:
1) Use Taskopad’s detailed target graphs to see how your business is doing. This report can help you make decisions about areas of your business that need improvement.
2) Use marketing reports to understand which channels best promote your product or service. This information can help you allocate resources more efficiently.
3) Use sales reports to identify which sales channels are performing well and which need improvement. You can then focus on these channels in future campaigns.
4) Use operational reports to see how your business performs in different operations (such as production, customer service, and finance).
Conclusion
In this blog, we have learned that target graphs help decision-making in business by providing a visual representation of existing data.
By comparing different reports provided by Taskopad, decision-makers gain a better understanding of the data and make more informed decisions.
Besides, target graphs help decision-makers prioritize their reports and understand which are the most critical for decision-making.
If you want to make crucial decisions faster and reduce the risk of making mistakes, target graphs are the report type to focus on first. Found this useful? Check more!
Search by posts
Search by posts
Recent posts
12-12-2024
Task Management Software
